
Keyword
Earth Science | Oceans | Coastal Processes | Sea Surface Height
5 record(s)
Type of resources
Topics
Keywords
Contact for the resource
Provided by
Formats
Update frequencies
Status
draft
-
Reconstructed sea-surface heights for 1950 to 2001 as described in Church et al. (2004), except that it has been extended to the end of 2001. Briefly, this data set is: - near-global (65°S to 65°N) from January 1950 to December 2001 on a 1° × 1° × 1 month grid - seasonal signal removed - inverse barometer correction made - GIA (Mitrovica) correction made to tide gauge data
-
This file contains the monthly Global Mean Sea Level (GMSL) time series as shown on figure 2 of Church and White (2006). The sea level was reconstructed as described in Church et al (2004).
-
Dynamic height of sea surface height and currents referenced to 2000m, computed from CARS2000 3-dimensional seasonal temperature and salinity fields. Monthly values derived from annual and semi-annual temperature and salinity cycles. CARS is a set of seasonal maps of temperature, salinity, dissolved oxygen, nitrate, phosphate and silicate, generated using Loess mapping from all available oceanographic data in the region. It covers the region 100-200E, 50-0S, on a 0.5 degree grid, and on 56 standard depth levels. Higher resolution versions are also available for the Australian continental shelf. The data was obtained from the World Ocean Atlas 98 and CSIRO Marine and NIWA archives. It was designed to improve on the Levitus WOA98 Atlas, in the Australian region. All known reliable published data is used, but this is still very sparse in the SW, at depth, and especially for some nutrients. In many places strong interannual signals (which in many cases we do not attempt to resolve nor compensate for) may be aliased into spatial or seasonal signals.
-
GFO is a radar altimeter used to measure ocean wave heights and currents. This data set covers the period from 07-Jan-2000 to 02-Jun-2008. The data set comprising near global (72S - 72N) sea surface height anomalies, the along ground tracks are repeated every 17 days and are the same the same ground track as GEOSAT. The data has been processed at CSIRO Marine Research in Hobart to a uniform grid spacing and format, there is one file for each satellite pass and the data files are in a simple binary format.. It is available on-line on the CSIRO Marine Research network; also available to outside users on request.
-
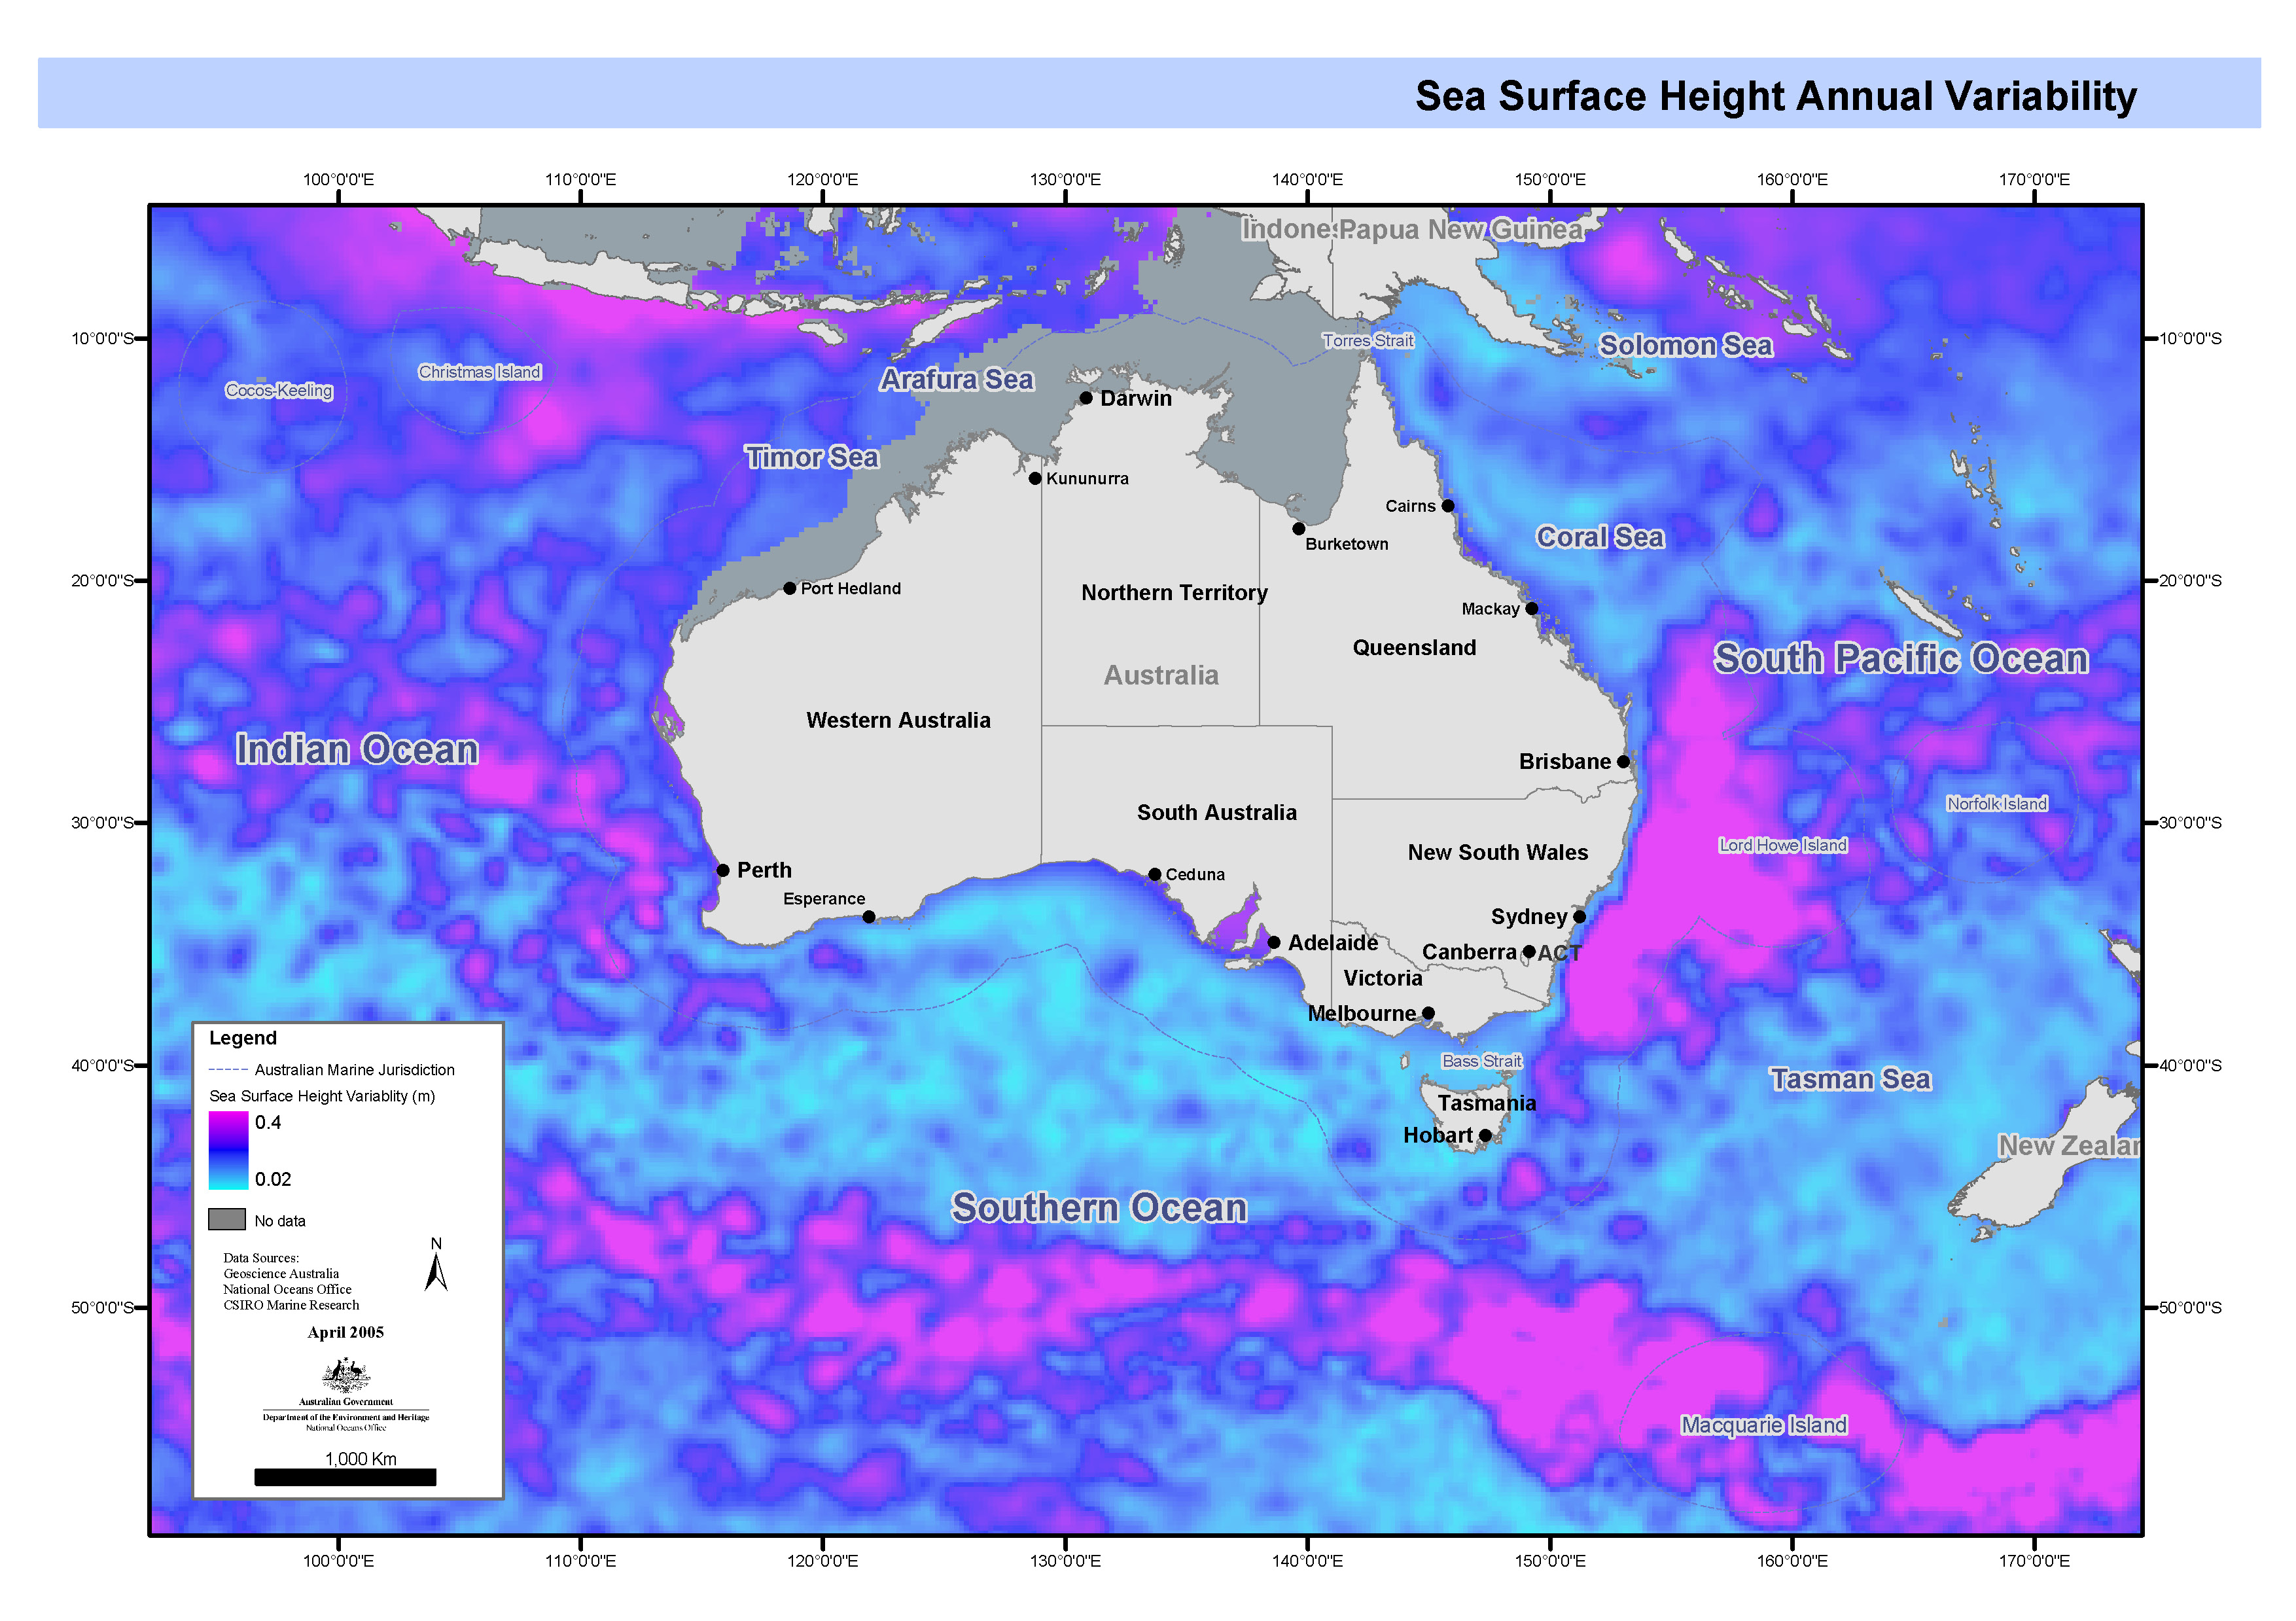
Map showing the total standard deviation of sea surface height in the Australian region for 1993-2001 based on tide gauge and altimeter observations.This map has been produced by CSIRO for the National Oceans Office, as part of an ongoing commitment to natural resource planning and management through the 'National Marine Bioregionalisation' project.